Overview
This project highlights historical questions pertaining to the development of the public sphere in Columbia County, NY, during the 19th century by mapping various contemporary data related to social organization and communication: libraries, newspapers, rail lines, and post offices. These questions are inherently geographic and spatial insofar as the development of railroad lines throughout Columbia County inevitably resulted in county residents experiencing an “annihilation of space and time” similar to other Americans during the era of industrialization.1 But what did these changes look like? What do the development and proliferation of these institutions tell us about how the public lives of these New Yorkers changed during this period? What were the effects of new modes of transportation and commerce?
This project began as a way to explore techniques for raising historical questions about the development of the public sphere during the 19th century in Columbia County, NY, by mapping and interrogating geographic data. “Assembly and Association” takes its title from Jürgen Habermas’s articulation of the public sphere as a space where individuals meet and promote their ideas in a manner of discourse that is inherently public and communal.2
Data
As noted in the Historical Background section of this project, Columbia County in the 19th century serves as a useful model for its geographic location and makeup. The “two significant rail centers” at the heart of the county, Hudson and Chatham,3 connected Columbia to commercial centers near and far, while the rest of the county was filled with rural farmland and small towns.
My initial goal was to develop a project that would allow me to consider the impact of railroad expansion in New York state on the spread of religious institutions during the railroad’s most explosive period of growth, the mid-to-late 19th century. I was curious to see what if any effect this new system of travel and transport of commercial goods and ideas would have on how rural and semi-rural New Yorkers organized their spiritual lives. I began by looking at historic railroad maps, visualizations, and data from a number of sources. Stanford’s Spatial History Project highlighted the various applications of historic railroad data,4 which was helpful for brainstorming directions to take the work in–but less so for providing data to work with, given that the focus of this suite of projects is the American West. Eventually, I landed at the University of Nebraska-Lincoln’s “Railroads and the Making of Modern America” project site.5 UNL’s project not only offers dynamic maps and essays broken out by historical topic; the site also provides railroad data between 1840 and 1870 in the form of GIS, KML, and Shapefiles,6 which I used in this thesis.
From there, I started looking for historic religious data in New York. Thanks in part to Lincoln Mullen’s extensive work, documentation, and data collection on the topic of American religious history,7 I traced the geographic spread of various faiths by examining NHGIS census data, as well as religious almanacs, yearbooks, and meeting minutes notes, in order to determine the scope and scale of the proliferation of churches and parishioners throughout New York during the 19th century. There was much information to go on; however, mapping this data to reflect change over time became problematic: while the ascendent faiths in 19th-century New York–the revivalist Methodist and Baptist sects, according to historians Mark Noll, Roger Finke and Rodney Stark, and George Marsden–maintained scrupulous records, I was unable to find information about when each church was built.
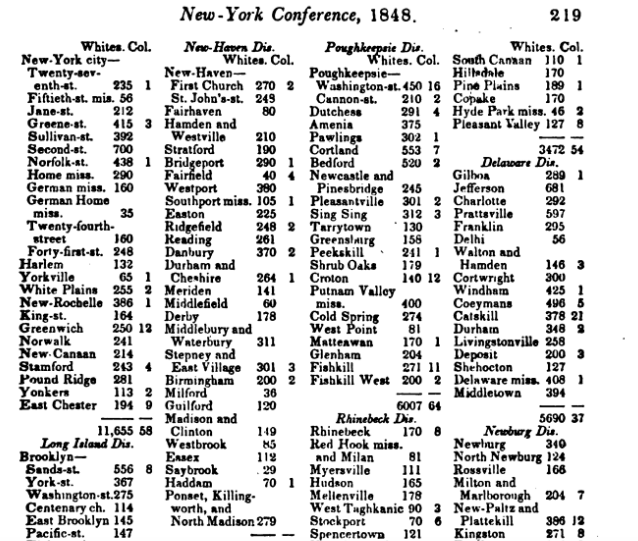
For example, here is an excerpt from the Methodist Meeting Minutes of 1848, showing the sites and number of parishioners for each Methodist church in the New York Conference, which governs Columbia County.
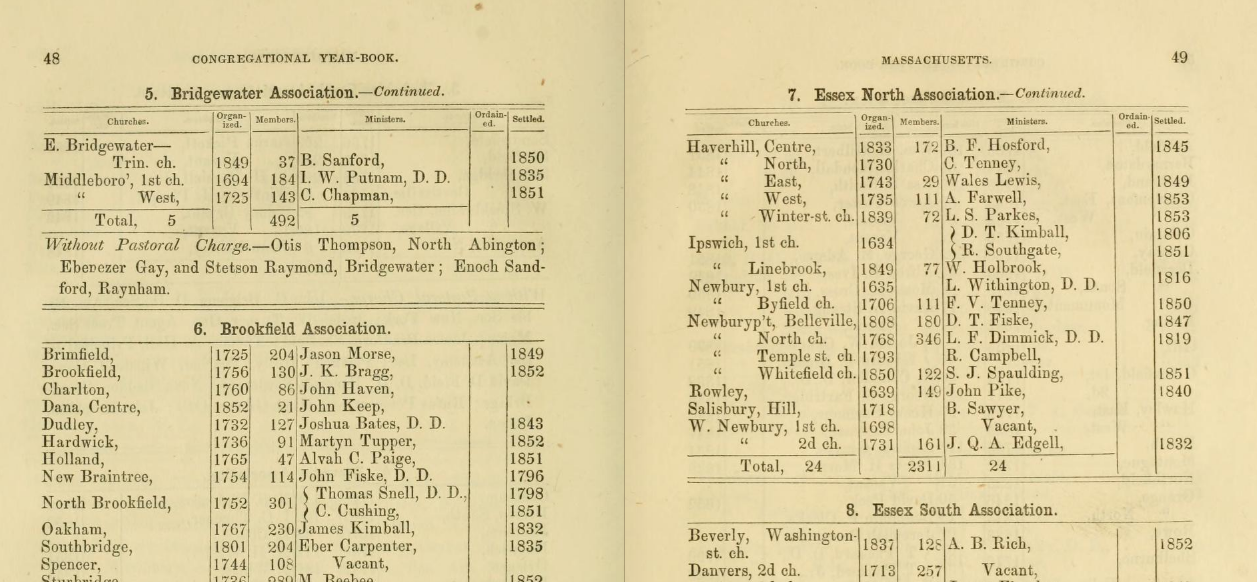
Compare this with the Congregationalists in New England, as Lincoln Mullen demonstrates,9 who recorded the location and the year of organization for each church.10
This meant that, in order to show the spread of churches throughout Columbia County over time, I would have had to examine each denomination’s yearly records looking for new churches–an onerous task that, like tallying changes in parish sizes, cries out for a computational solution. In future iterations of this project, I would like to explore such solutions.
After spending time tinkering with these church records and trying to determine how best to represent church expansion on local and regional scales, I ultimately ended up using NHGIS census data to parse religious data at the county level in New York in the mid-to-late 19th century. Without exact church locations, this seemed the best strategy, as it would still allow me to draw some conclusions about spiritual life in a region undergoing massive upheaval thanks to the expansion of the railroad system. In addition to looking at census data about the number of churches, I also recorded what the census termed the “aggregate accommodations”–what we might know as the seating capacity of the average church–and the “property value” of each denomination’s churches in total. I chose these categories because they would allow for geographic extrapolations: for example, one might investigate the changes in total church buildings and their value and by asking what changed to the land on or around which they were built, or what demographic trends might have driven these changes.
What became clear was that the Methodist sect far outpaced its counterparts during this period, mirroring the larger national trend.11 Still, I recognize that county-level data, and indeed data furnished by the census, which is not the most precise measurement, has its pitfalls; as Mullen writes, US census data is handcuffed by, among other factors, imprecise questions stemming from census takers’ “concerns about church and state.”12
Nevertheless, for the purposes of this project–which offers a starting point for future investigations and models an approach that combines various threads of historical mapping–NHGIS furnished useful census data on the topic of religion. Importantly, the US census began asking questions about religion with the 1850 census, and continued until the formation of the Census of Religious Bodies in 1906.13 At the time of writing, NHGIS does not provide religious data for the US censuses of 1880 or 1900–so for this project, I gathered data from the 1850, 1860, 1870 and 1890 census results. The gap between 1870 and 1890 point to another issue with NHGIS data, but one which will have to be overlooked for this project.
In the end, I could not settle on a compelling visualization for the religious data that I collected. For example, I experimented with creating, among many other variations, chloropleth maps showing the frequency of churches per square mile, or the value of church property by denomination, but these seemed inadequate representations. Elsewhere, I created layers within Carto, whereby users could hover over Columbia County and read the statistics I’d gathered on pop-up information windows–but this too seemed to belie the driving aim of the project as a resource for building questions relevant to historical geography. Finally, I decided to post my data table to this project in lieu of a corresponding map. This way, readers can see what the pre-mapping data looks like, and I can write transparently about the difficulties I encountered trying to map source information. I learned throughout this project that historical sources often do not exist in formats that are easy to work with. Making sense of and standardizing each data point is one thing; but then understanding what visual representation best suits this information, and accepting that it might not work out perfectly, is quite another. This, I think, is at the heart of digital humanities work, and is certainly related to its cardinal acceptance of failure.14
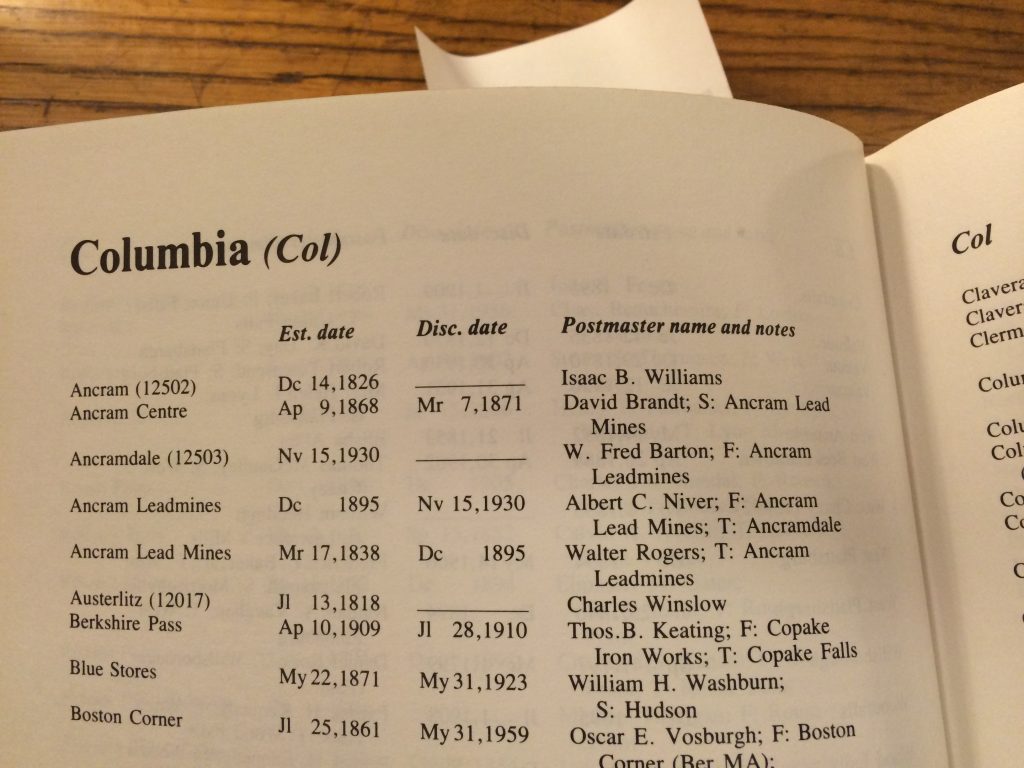
As I considered the spread of churches and railroads in Columbia County, I became increasingly interested in how the railways intersected with the development of other institutions that represented and shaped aspects of American life beyond the spiritual. Stanford’s Spatial History Project and its “Shaping the West” projects, and in particular Cameron Blevins’s “Geography of the Post” (GOTP)–a phenomenal investigation and dynamic visualization on the expansion of the US Postal System in the American West of the 19th century, which forms part of Blevins’s dissertation15–were instrumental in helping me understand additional ways to look at historical geographical information adjacent to the railroad network. In the spirit of GOTP, I tracked down New York Postal History at the New York Public Library and logged the names and dates for post offices that went up in Columbia County in the 1800s, in order to begin framing questions about the expansion of the postal system here and its effect on public life.
What was the demand in Columbia County for post offices? What might the expansion of the post during this period tell us about the “broadly inclusive network” of communication via post?16 As Blevins notes, “no other public institution was so ubiquitous and so central to everyday life” as the post office, which provided access to “the nation’s largest communications network in the nineteenth century.”17 The postal system offers an entry point into mass communication, how these Americans shared information, organized communal spaces, and possibly how they imagined themselves as connected to one another across space and time.
Beyond the post in isolation, as David M. Henkin notes, the US postal system and American newspapers were historical complements: the former was seen in many ways as the primary vehicle for distributing political information to the American people, while the latter served as the medium itself for collecting and broadcasting political ideas and developments.18 To this end, I wanted to include information about newspapers in Columbia County during this time period to supplement postal data and add to the picture of mass communication and public life. The Library of Congress’s “Chronicling America” project provides data about historic American newspapers,19 and so I searched for and downloaded geographic and titular information about Columbia County newspapers in the 19th century. I was interested in how, taken together, data about the US post and newspaper system might offer insights into how this public thought of itself as readers, writers, and communicators; in particular, examining how “as with the proliferation of so many artifacts of the expanding antebellum print culture (including newspapers, novels, political pamphlets, urban signage, and fashion magazines), the increasing availability and affordability of the post encouraged the acquisition, cultivation, and maintenance of literacy” and a sense of ownership over ideas and information.20 To do so, I wanted to combine the efforts of Blevins with the “Chronicling America” project to simultaneously plot post offices and newspapers throughout this time and place.
Finally, I wanted to look at the growth of public lending libraries in Columbia County during this historical period. As a trained librarian, I am interested in the history of libraries in America and mapping their spread in order to raise questions around the intersection of libraries and broader pictures of literacy, information dissemination, and community. Columbia County’s New Lebanon, NY, is the site of the nation’s “first free public library,” formed in 1804; thus county residents were arguably long accustomed to the democratic ideals inherent within public libraries.21 How did the public incorporate libraries into their practices and understanding of themselves as readers, writers, and communicators? To find the data required to begin supporting these questions, I researched using the Mid-Hudson Library System22 and collected information about Columbia County libraries built in the 19th century.
So for this project, Columbia County, NY data consisted of:
- KML files for historic railroad data between 1840 and 1870
- Statistics about the number of churches, aggregate accommodations, and church property value by denomination, from the US Census years of 1850, 1860, 1870, and 1890, all furnished by the NHGIS.
- The names, locations, and dates of operation of 127 post offices built between 1786 and 1900.
- The names, locations, titles, and publishing dates of 68 newspapers that ran between 1792 and circa 1900.
- The names, locations, and dates of operation of 4 libraries built between 1804 and 1902.
The value in bringing these data sources together into a single examination lies in their representing a number of institutions related to public life and space during this period. By considering them side-by-side, “Assembly and Association” makes an argument on behalf of connecting the approaches taken by the historians and projects cited throughout.
While my data and sources correspond to the period between 1840 and 1900, there are gaps, overlapping eras, and incomplete records that make establishing a perfectly clean and orderly period of inquiry difficult to establish. Railroad data covers 1840-70; church data covers 1850, 1860, 1870, and 1890; and my newspaper, post office, and library information covers the entire period from 1786 to roughly 1902. The focus of the project is the period between 1840 and 1890, the bookend dates coming from the earliest historic railroad map and the latest pertinent census information. However, in order to better frame questions about change over time, I have included relevant data leading into and coming out of this 50 year period.
I organized and standardized this data using Google Spreadsheets, which I chose because this tool reads and generates CSV data and so that I might store my data alongside my project journal, notes, and draft writing assignments. Organizationally, it was important for me to keep everything in a central repository. Because I was working with an amount and type of data that was either preformatted (in the case of KML files) or that I could manage hand-coding, and since I knew that there was no significant danger of running into problems with versioning on this project, I opted not to use a separate data storehouse such as GitHub.
Mapping
I then turned to choosing a mapping platform. Several considerations were key: ease of use; integration with my project site on the CUNY Academic Commons; and the ability to render dynamic, and not merely static, maps.
For this project, and based off of advice from CUNY Graduate Center Digital Services Librarian Stephen Klein, QGIS and ArcGIS seemed to be overkill. Though I would later lament not being able to create multiple layers for these maps, at the outset of the project my feeling was that the more gradual the learning curve the better. After experimenting with several alternatives, I settled on CartoDB (now called simply Carto), for its promising seamless website integration and publication of dynamic maps and visualizations of tabular data. From that point on, my focus was on generating simple, data-driven maps that would allow users to see how historic geographical information went from source to screen. My hope for the visualizations, and indeed for the project at large, is for users to interact with the information and begin to frame historical questions with a geographic focus; that is, to investigate how space and place determined or were otherwise affected by the colocation of these institutions and phenomena. For example, did post office locations determine whether and how many newspapers published in a certain area? Or, what is the relationship between railway stations and churches: were ecclesiastical organizations–and which ones in particular–more or less likely to build a church in a town recently turned into a stop on a rail line? I was motivated by the extraordinary work coming out of departments–such as Stanford’s Center for Spatial and Textual Analysis, which oversees the Spatial History Project, and University of Nebraska-Lincoln’s Digital History Project, which oversees the “Railroads” project–and undertaken by individuals, such as Lincoln Mullen, among others credited here and in the Environmental Scan; my intentions for this project are merely to put some of these projects next to one another–that is, to bring together some of the sources and approaches that others use and play out what would happen if we were to consider, for example, the expansion of railways alongside the growth of print culture. Moreover, I think all of these institutions and phenomena structured the development of the public sphere during this time period. I want users to be able to consider how and why these institutions developed in certain ways in a finite space, by looking at these data sets in total and in dialogue with one another.
Still, mapping in and of itself proved a challenge throughout this project for several reasons. There was often a tension between the results I wanted and those that I was able to produce given my technical background. During my Digital Humanities Praxis II course at the CUNY Graduate Center, I worked with a group of talented classmates to build Digital HUAC, a prototype for collecting and rendering searchable the corpus of testimony from the House Un-American Activities Committee hearings.23 We went through a number of iterations of the site, ultimately producing a public-facing final project that we were proud of–but along the way we devoted a majority of our time to technical troubleshooting. Perhaps this is always the case with DH projects, but it was an experience that certainly influenced my decision to keep things as technically straightforward as possible with “Assembly and Association.” The results of this decision, however, were limiting. Most notably was the problem of clustering overlapping results. Google Maps and Leaflet.js both include workarounds for “spiderifying” visualizations, so that when a single geographic location contains multiple instances, users may hover over or click on the single point and the multiple results separate. Here is an example from Leaflet:24
Such a display feature would have significantly improved the experience of viewing, say, information related to the 37 newspapers printed in Hudson or 10 printed in Kinderhook, documented here. Carto does have a cluster map type, which indicates the number of data points for a given location; but this is not as elegant as a “spiderified” or marker cluster solution:
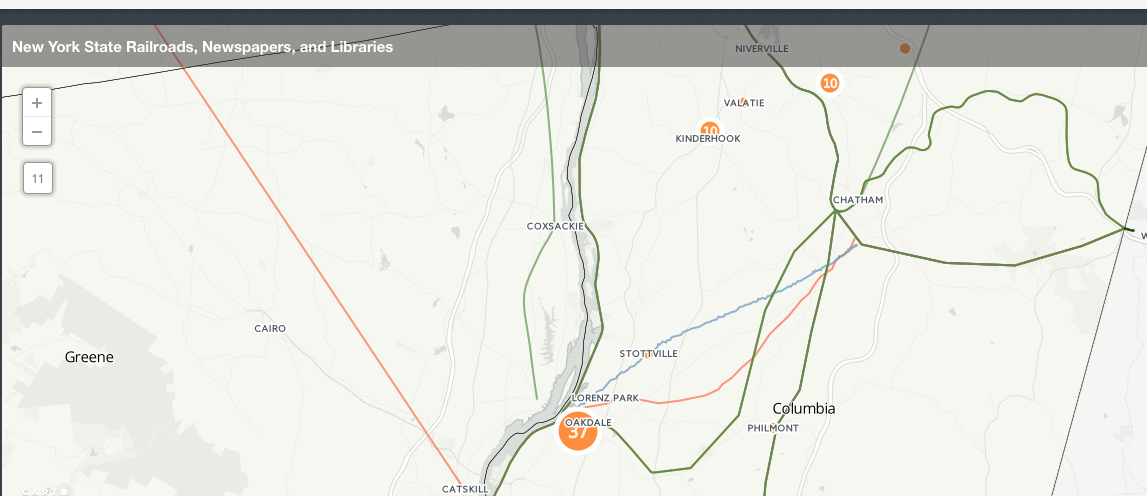
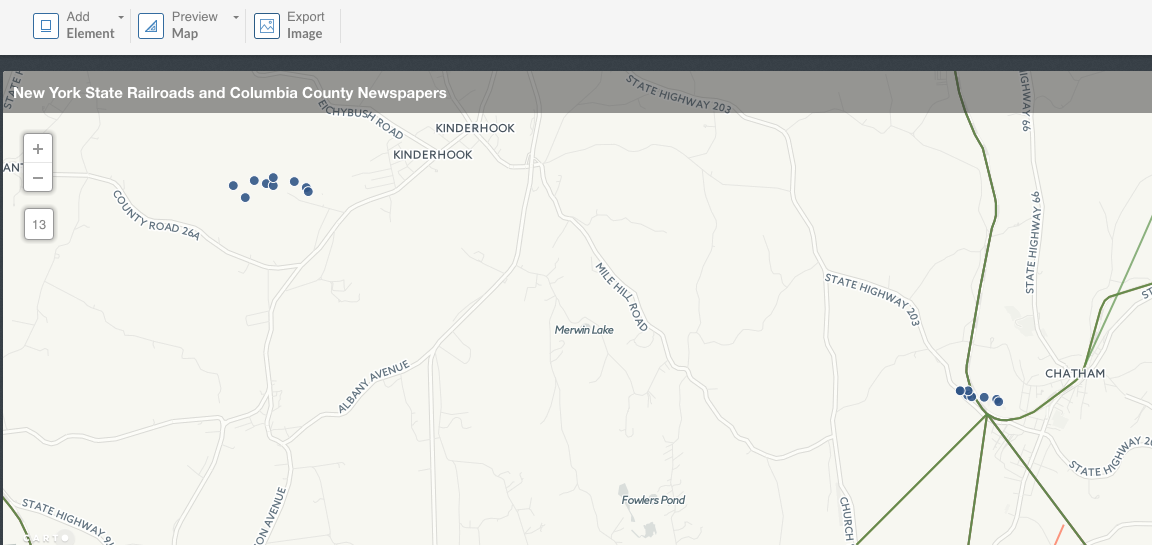
I eventually settled on altering the geographic coordinates in my data tables for each newspaper, though just enough to show some separation between these points. Without information pertaining to the addresses at which each newspaper was printed, it seemed the best option, even though the resulting map plotted, for example, the Kinderhook newspapers as distinctly afield from Kinderhook itself:
Related to this, Carto helpfully includes a torque map which animates data over a fixed duration based on date-number strings in the data. This is a really useful and dynamic way to visualize the establishment of certain institutions and show how quickly they appeared in a given time frame. However, when I selected the torque option, the map lost its display information–so users would be able to see when and where newspapers sprang up, but they would not be able to identify them by title.
Future Iterations
In general, future versions of this project would benefit from a technical upgrade. CUNY supports ArcGIS, so this is likely a best option.25 Further, much of the detailed work that Lincoln Mullen has done to help historians and digital humanists think about mapping techniques and protocol relies on the programming language R.26 To truly take this project into its next phase, I would likely build my maps from the ground-up using ArcGIS or QGIS, another mapping tool, utilizing some of Mullen’s strategies and best practices for parsing and mapping historical data.
Beyond technical concerns, I would eventually want to use “Assembly and Association” to explore the pedagogical applications of digital history projects; as a history teacher, librarian, and masters student working at the juncture of history and digital humanities, I am interested in exploring how such projects could be brought into the classroom. In my DH Praxis I course, I wrote about the instructional promise of digital history projects: by engaging with historical sources in a networked environment and presenting “a suite of interpretive elements” around them, such projects allow “readers [and students] to investigate and form interpretive associations of their own” while diving into the source material themselves.27 In so doing, students would hopefully gain an understanding that “no one map, image, or diagram could represent historical conditions and ways of life, let alone the many modes of geographic analysis and interpretation” available; in other words, that they must work with maps as any other text or source, mining it for information and interrogating its meaning.28 And so in its presentation of source data and interactivity, “Assembly and Association” seeks to appeal to history teachers looking for projects to include in lessons on historical geography, map literacy, plotting and parsing historical data, and using maps to help frame historical questions.
End Notes
1. Wolfgang Schivelbusch, 1986. The Railway Journey. Berkeley, Calif.: University of California Press, p. 33.
2. Jurgen Habermas, Sara Lennox, and Frank Lennox. 1974. “The Public Sphere: An Encyclopedia Article (1964)”. New German Critique, no. 3: 49-55. doi:10.2307/487737.
3. Dale Nicholson, 2004. “Columbia at Mid-19th Century…and Beyond.” Columbia County History & Heritage (3:3). Kinderhook, NY: Columbia County Historical Society, p. 5.
4. “Shaping The West”. 2016. Spatial History Project. https://web.stanford.edu/group/spatialhistory/cgi-bin/site/project.php?id=997.
5. William G. Thomas III et al. “Railroads And The Making Of Modern America”. University Of Nebraska-Lincoln. Accessed August 12. http://railroads.unl.edu/.
6. Ibid., http://railroads.unl.edu/resources.
7. Lincoln A. Mullen. “Digital Projects.” Blog. Lincoln Mullen. http://lincolnmullen.com/#digital-projects; Lincoln A. Mullen, 2016. “A Very Preliminary Taxonomy Of Sources Of Nineteenth-Century U.S. Religious Data”. Blog. Lincoln Mullen. http://lincolnmullen.com/blog/a-very-preliminary-taxonomy-of-sources-of-nineteenth-century-us-religious-data/#read-more; Lincoln A. Mullen. Historical Statistics of Religion in America. Dataset and source code. 2013–. http://github.com/lmullen/religious-statistics.
8. Minutes of the Annual Conferences of the Methodist Episcopal Church, Vol. 3 1839-1845. New York: Published by T. Mason and G. Lane for the Methodist Episcopal Church, 1840-1940.
9. Lincoln A. Mullen, 2015. “Next Steps In Mapping U.S. Religious History”. Blog. Lincoln Mullen. http://lincolnmullen.com/projects/asch-2015/.
10. “American Congregational Yearbook For The Year 1854”. 1854. Internet Archive. https://archive.org/details/americancongrega04amer
11. Roger Finke and Rodney Stark, 2005. The Churching Of America, 1776-2005. New Brunswick, N.J.: Rutgers University Press, pp. 53-56.
12. Lincoln A. Mullen, 2016. “Where The Problem With Historical Data About U.S. Religion Really Lies”. Blog. Lincoln Mullen. http://lincolnmullen.com/blog/where-the-uncertainty-about-religious-statistics-lies/#read-more.
13. Anne Farris Rosen, 2010. “A Brief History Of Religion And The U.S. Census”. Pew Research Center’s Religion & Public Life Project. http://www.pewforum.org/2010/01/26/a-brief-history-of-religion-and-the-u-s-census/.
14. Anne Burdick, et al. 2012. Digital Humanities. Cambridge, Mass.: MIT Press, pp. 21-22.
15. Cameron Blevins, 2016. “Research”. Cameron Blevins. Accessed August 12. Blog. http://www.cameronblevins.org/research/.
16. David M. Henkin, 2006. “The Postal Age: The Emergence Of Modern Communications In Nineteenth-Century America By David M. Henkin, An Excerpt”. Press.Uchicago.Edu. http://press.uchicago.edu/Misc/Chicago/327205.html.
17. Cameron Blevins, 2015. “Geography Of The Post”. Cameron Blevins. http://cameronblevins.org/gotp/.
18. Henkin, 2006.
19. “Chronicling America « Library Of Congress”. 2016. Chroniclingamerica.Loc.Gov. http://chroniclingamerica.loc.gov/.
20. Henkin, 2006.
21. “About At New Lebanon Library – New Lebanon, NY”. 2016. Newlebanonlibrary.Org. http://newlebanonlibrary.org/about-us/.
22. “Library Development: Find Your Public Library In New York State”. 2016. Mid-Hudson Library System. Accessed August 12. http://www.nysl.nysed.gov/libdev/libs/publibs/3mh.htm.
23. “Digital HUAC”. 2015. Digitalhuac.Com. The Graduate Center, City University of New York. http://digitalhuac.com/index.html.
24. George MacKerron, Overlapping Marker Spiderfier for Google Maps API v3. Source code. 2012–. https://github.com/jawj/OverlappingMarkerSpiderfier ; Leaflet. Leaflet.markercluster. Source code. 2012–. https://github.com/Leaflet/Leaflet.markercluster ; Dave Leaver, 2012. “Leaflet.Markercluster 0.1 Released”. Leaflet. http://leafletjs.com/2012/08/20/guest-post-markerclusterer-0-1-released.html ; Leaflet,. 2012. Leaflet Markercluster Map. Image. http://leaflet.github.io/Leaflet.markercluster/example/marker-clustering-realworld.50000.html.
25. “Mapping Data”. 2015. Research Guides At CUNY Graduate Center’s Mina Rees Library. http://libguides.gc.cuny.edu/mappingdata ; “Getting Started – Intro To Arcgis”. 2015. Research Guides At CUNY Graduate Center’s Mina Rees Library. http://libguides.gc.cuny.edu/arcgisintro
26. Lincoln A. Mullen, 2015. “Spatial Humanities Workshop”. Blog. Lincoln Mullen. http://lincolnmullen.com/projects/spatial-workshop/ ; Lincoln A. Mullen “Digital History Methods In R”. Blog. Lincoln Mullen. http://lincolnmullen.com/projects/dh-r/.
27. Douglas Seefeldt and William G. Thomas III. 2009. “What Is Digital History?”. American Historical Association. https://www.historians.org/publications-and-directories/perspectives-on-history/may-2009/intersections-history-and-new-media/what-is-digital-history.
28. Knowles, Anne Kelly. 2014. “Why We Must Make Maps: Historical Geography as a Visual Craft”. Historical Geography 42: p. 7.